
Summary of Research Results
☑ Changes in Output Value and Service Visits
In H1, both the output value and service visits of the aftermarket declined by 5% YoY, with both in each month of Q2 falling below the levels of the same period last year.
In H1, maintenance demand across different city tiers showed significant divergence. Service visits in first-tier and new first-tier cities dropped by over 6% YoY, while the declines in second-tier and below cities were all within 5%.
In H1, all business segments faced notable pressure. In Q2, the output value of repair, tire, maintenance, refinishing, and accessories services faced both YoY and QoQ declines.
☑ Category Sales
In H1, battery sales volume increased by 5% YoY, while control arms, shock absorbers, and water pumps achieved modest growth of 1%-4% YoY. However, sales volumes of engine oil, oil filters, and other categories declined by over 5% YoY.
In Q2, 9 categories including engine oil experienced simultaneous declines across all regions, while brake fluid and ignition coils maintained positive growth only in Northeast China. Southwest China performed poorly, with sales volumes of all monitored categories trending downward YoY.
In Q2, 13 categories including engine oil saw collective sales volume declines across all city tiers. By city tier, tier 2 and above cities faced particularly pronounced pressure, with multiple categories experiencing YoY sales volume declines exceeding 10%.
☑ Vehicle Brand
In H1, among major automotive brands, BYD led in service visits YoY growth at over 6%, while Hyundai, Kia, Chevrolet and others saw service visits decline by over 10% YoY.
In H1, ICE vehicles recorded an 8% YoY decline in both maintenance output value and service visits, while NEVs bucked the trend with double-digit YoY growth in both metrics, highlighting a stark contrast between conventional and new energy vehicle segments.
In H1, among major NEV brands, Xiaomi led with a dominant 124% growth, while emerging players like AITO, GAC Aion, and Zeekr posted significantly higher YoY growth in service visits compared to established brands like BYD and Tesla.
☑ Industry Trends
In H1, the share of service visits in third-tier and below cities showed a slight upward trend. Leveraging stronger resilience and growth potential, lower-tier cities have become a key force in stabilizing the overall aftermarket performance.
In Q2, the share of service visits from NEVs continued to rise to 13.3%, up 3.6 percentage points from the same period last year, indicating deepening market penetration.
It is projected that the YoY declines in aftermarket output value and service visits will remain at 5% for the full year of 2026, with downward pressure persisting.
重点数据解读
01. Output Value/Service Visits YTD YoY in 2026
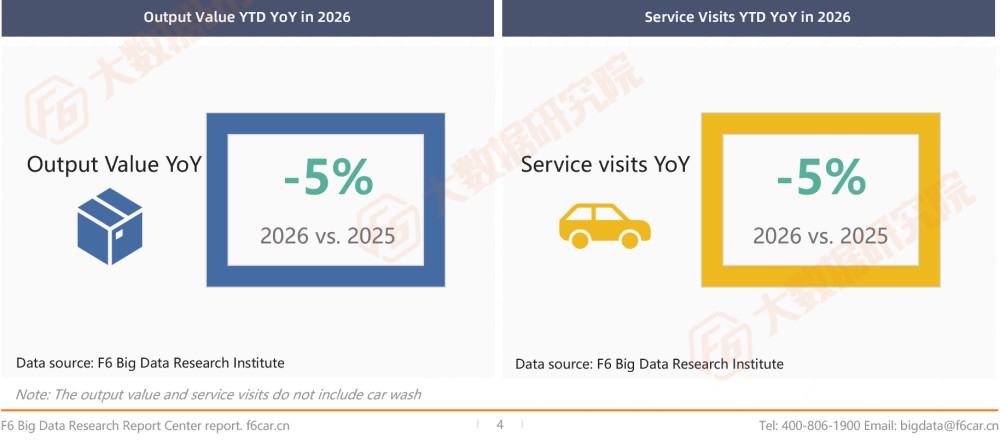
In H1 2026, both the output value and service visits YTD of the automotive aftermarket declined by 5% YoY. Compared to the 3% YoY decline in Q1, the downward pressure intensified, with the overall industry performance falling short of expectations.
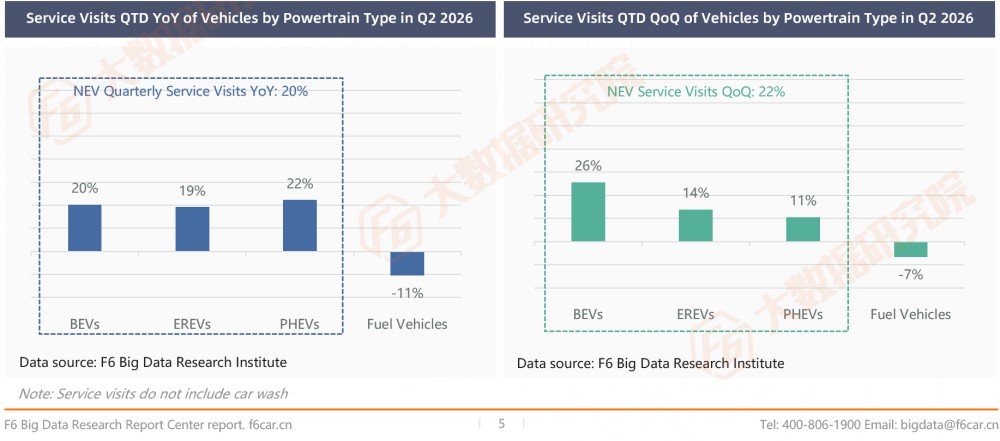
02. Service Visits YoY/QoQ of Vehicles by Powertrain Type in Q2
In Q2, ICE vehicles saw service visits decline by 11% YoY and 7% QoQ, showing a notable demand contraction trend. In contrast, NEVs saw significant YoY and QoQ growth in service visits across all powertrain types.
Combining the output value data above, it can be seen that the service visit growth of EREVs far outpaced their output value growth, indicating both YoY and QoQ declines in per-visit spending for this segment. This reflects that consumer caution and spending cuts also exist among NEV owners.
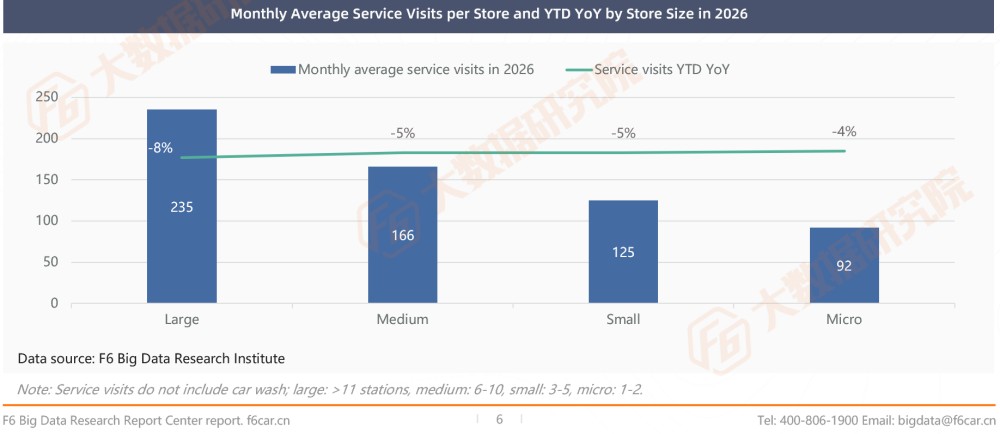
03. Service Visits YTD YoY by Store Size in 2026
In H1 2026, service visit data across stores of different sizes showed distinct tiering characteristics: smaller stores experienced narrower YoY declines, while larger stores with more stations were significantly more affected by the industry downturn.
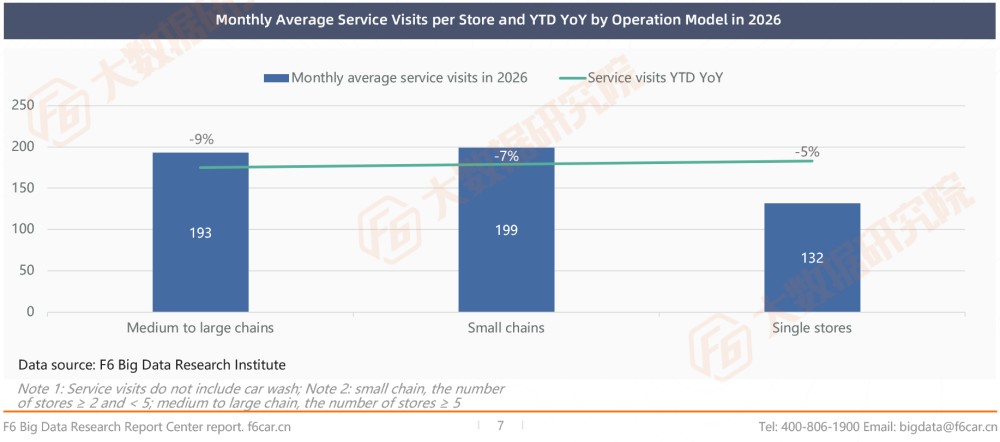
04. Service Visits YTD YoY by Operation Model in 2026
In H1 2026, medium-to-large chain stores saw service visits decline by 9% YoY. Compared to Q1 data (medium-to-large chains: -8%, small chains: -5%, single stores: -2%), the gap in decline rates between medium-to-large chains and other store types has narrowed notably.
Some medium-to-large chains expanded rapidly and are now under short-term operational pressure amid weak market demand. However, given industry dynamics, they possess a stronger risk-resilience foundation, and this weakness may be a temporary phase.
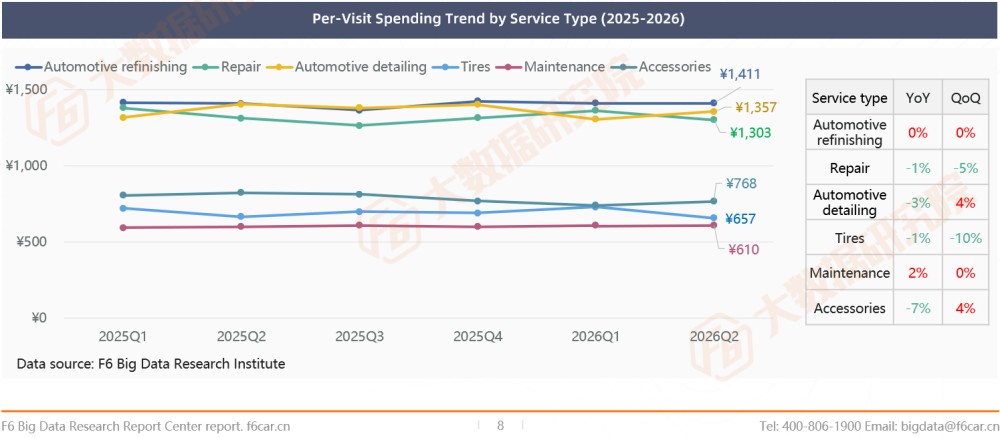
05. Per-Visit Spending Trend and YoY by Service Type
In Q2 2026, automotive detailing and accessories saw per-visit spending grow 4% QoQ, showing clear volume-price synergy. In contrast, repair and tire services fell into a dual-decline channel, with tire services posting a 10% QoQ drop in per-visit spending, indicating significant pricing pressure.
06. Sales Volume YoY of Selected Categories in Q2
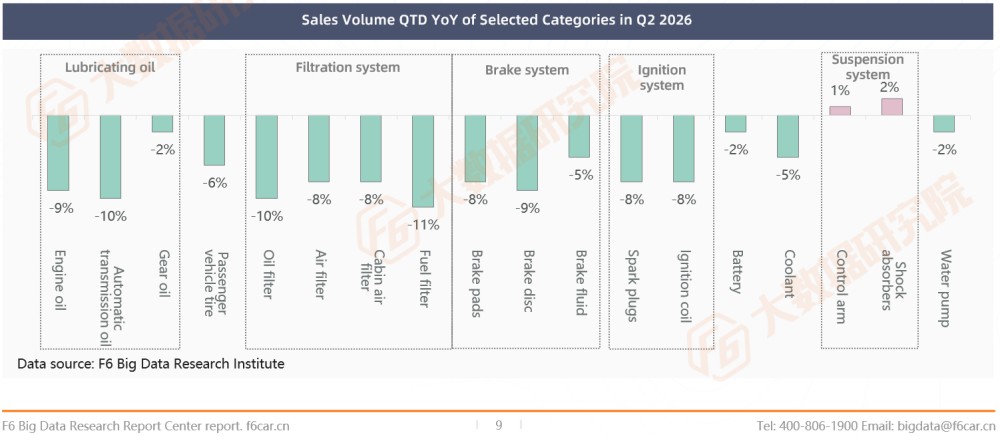
In Q2, among the following categories, only control arms and shock absorbers achieved modest 1%-2% YoY sales volume growth, while filters, brake system, ignition system and other routine maintenance parts saw YoY declines exceeding 5%, indicating sustained weak market demand.
07. Sales Volume QoQ of Selected Categories in Q2
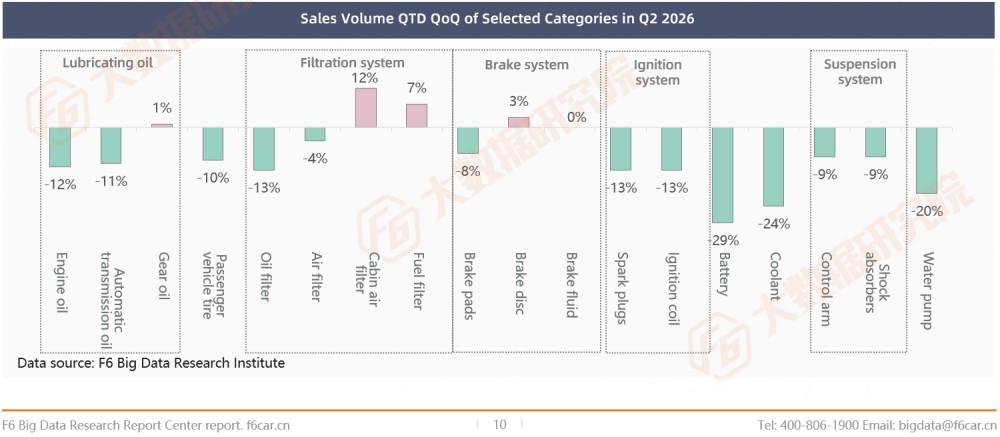
In Q2, cabin air filters and batteries showed seasonal sales volume fluctuations in peak and off-peak seasons respectively. Cabin air filters and fuel filters saw QoQ sales volume growth of 12% and 7%, while multiple categories including engine oil, automatic transmission oil, oil filters, batteries, coolant, and water pumps experienced QoQ declines exceeding 10%, clearly indicating a tightening demand trend in the quarter.
08. Service Visits QoQ of Selected Vehicle Brands in Q2
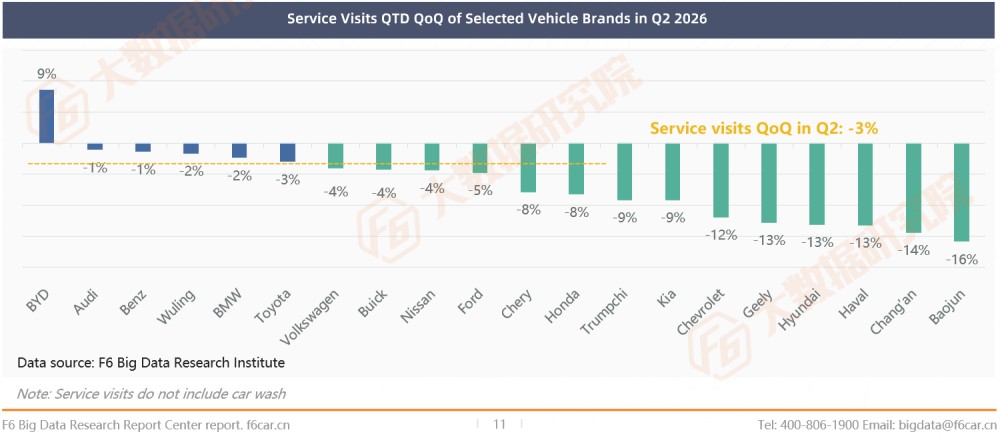
In Q2, only BYD achieved QoQ growth in service visits compared to Q1, while Volkswagen, Buick and other brands still lagged behind the aftermarket average in growth rates, with 6 brands including Chevrolet, Changan, and Baojun seeing QoQ declines exceeding 10%.
09. Service Visits YoY of Selected NEV Brands in Q2
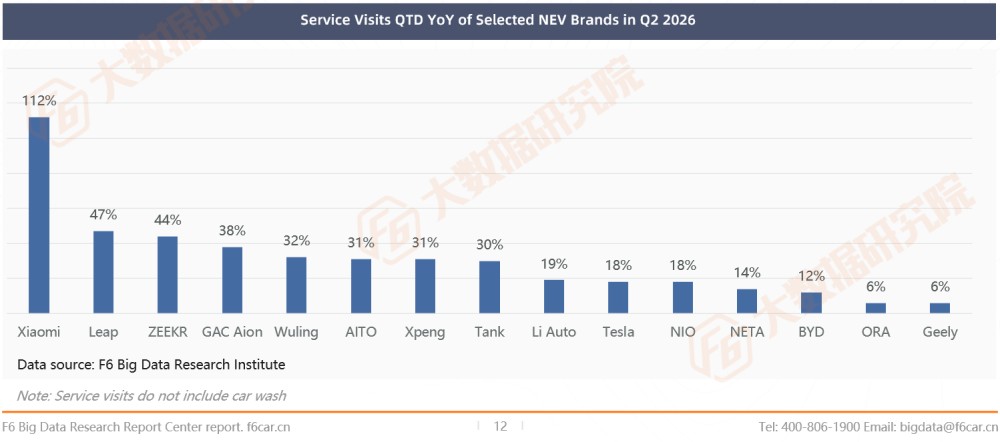
In Q2, all NEV brands saw YoY growth in service visits. Xiaomi led with a 112% YoY increase, while emerging brands like Leapmotor and Zeekr saw YoY growth exceeding 40%.
10. Industry Trends in Q2 2026
As of Q2 2026, the vehicle parc reached 370 million units; cumulative passenger vehicle retail sales in H1 declined 20% YoY.
① Aftermarket shifts focus from new car sales to existing vehicle upkeep
On June 23, the Ministry of Commerce and 8 other departments issued “Several Measures to Cultivate and Expand Automotive Aftermarket Consumption,” supporting 40 pilot cities for circulation reform, covering 6 major areas (repair, modification, used vehicles, RV camping, rental, classic cars) with 17 specific initiatives. Different from past short-term new vehicle subsidy stimulus, the new policy explicitly requires automakers to open up three-electric system repair technology and parts channels, prohibits warranty denial due to owners choosing independent social repair shops, breaks down 4S dealers' aftermarket monopolies institutionally, and directly benefits independent aftermarket chains, used vehicle reconditioning, and compliant modification sectors.
② Three-electric system repair becomes an incremental aftermarket segment
As of Q2 2026, the total vehicle parc reached 370 million units. Cumulative retail sales in the year to date reached 8.701 million units, down 20.2% YoY. NEV retail penetration stabilized above 62%, while the ICE vehicle stock continues to age and be phased out. In Q2, the closure rate of auto repair shops nationwide accelerated QoQ. Leading chains ramped up three-electric system diagnostics and battery balancing repair, while simultaneously signing direct original parts supply agreements with conventional automakers. Independent stores without NEV repair capabilities face a survival crisis, while chain stores with standardized three-electric system services are capturing market share.
③ Crackdown on illegal recycling and dismantling of end-of-life vehicles launched
The Ministry of Commerce and 6 other departments formulated the "Special Action Plan for Crackdown on Illegal Recycling and Dismantling of End-of-Life Vehicles," to investigate and punish illegal activities of recycling end-of-life vehicles under the guise of "used car acquisition" and reselling them to illegal dismantling sites or self-dismantling. For illegal recycling and dismantling sites identified, the vehicle sources shall be traced back to sever the illegal recycling chain. The auction records of end-of-life vehicles shall be inspected to identify subjects without recycling and dismantling qualifications acquiring end-of-life vehicles through auctions, and the vehicle flows shall be verified.
④ Two mandatory national safety standards for electric vehicles to be implemented in H2
Two mandatory national safety standards for electric vehicles — "Safety Requirements for Electric Vehicles" (GB18384-2025) and "Safety Requirements for Power Batteries for Electric Vehicles" (GB38031-2025) — will officially take effect on July 1. The new national standards focus on the electrical safety of electric vehicles, elevating the thermal runaway criteria for power batteries to "no fire, no explosion." At the same time, the new standards explicitly define "one-key power-off" as a physical power cut device for the first time, replacing the previous software-dependent control method to improve the reliability and timeliness of accident rescue operations.